Does Bigger Always Mean Better?

When assessing the strength of dental-insurance carriers, most people measure relative strength by the size of a carrier’s network. But is bigger always better – especially if bigger turns out to be not so big after all?

Network size can be measured one of three ways: by access points (the number of dentists practicing at all locations), by unique dentists, or by unique locations. Typically, reporting access points is the most popular method for measuring network strength; however, this provides an opportunity for errors and exaggeration.

One common source of inflated network listings is large multi-location clinics. These clinics typically employ a large number of dentists, with some dentists practicing at more than one location. That on its face does not cause problems; however, some dental-insurance carriers report every dentist associated with a large clinic as practicing at every location the clinic operates. When carriers engage in this practice, it is easy to see how network listings can quickly balloon far beyond what they truly should be.

Other common explanations for network inflation are easy to understand. Dentists can leave practices, move to other locations, get married, change names, retire, or die. While these are all normal life events, many carriers only update their network listings annually, or perhaps even less frequently. Inaccurate listings like this can then get picked up by data-mining services like NetMinder and reported as fact.

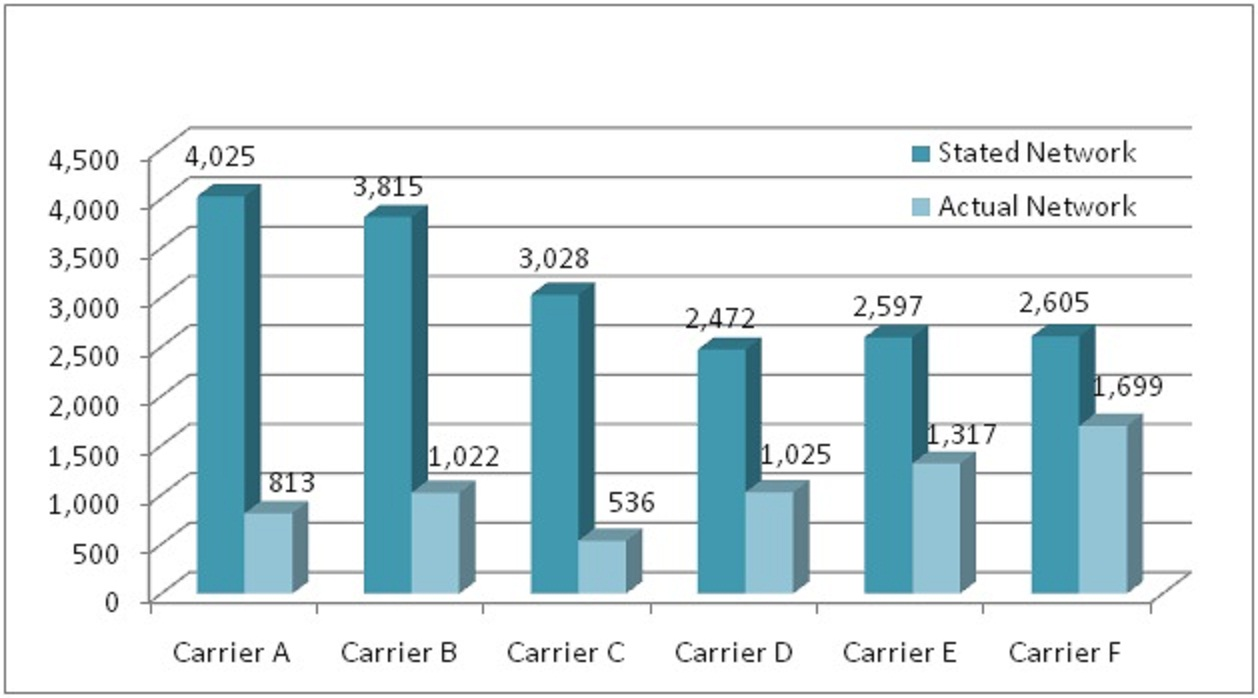
This chart delineates the inflation that can occur when carriers are not dedicated to maintaining accurate network listings. The chart shows several carriers’ network listings after being run against a list of verified dentist locations.  Clearly, some carriers are better than others, but it is quite an accomplishment for Carrier A to inflate the size of a dentist network by 495 percent.
Delta Dental of Wisconsin takes network integrity very seriously. Delta Dental network listings are audited several times each year, and appropriate updates to provider listings are made in near real-time. By maintaining good relationships with our network dentists, we are able to call or visit offices to find out which dentists are actually practicing at those locations. Information submitted to us today is on our website tonight.

This type of commitment to accurate reporting – and network-building — has become a valuable point of differentiation for Delta Dental of Wisconsin. We enjoy showing the inner workings and subtleties of network measurement and management to our customers and agent partners. (Want to know more? Contact us.)

Big networks – genuinely big networks — are about more than just big numbers. They’re the end result of longstanding relationships with the dental community, integrity, and the commitment to use networks to deliver value. We’re proud of what our dentist networks represent. We hope you feel the same way.
Ortho To Go

Contrary to perceptions, all children between the ages of 12 and 18 do not have braces – and not every dental plan pays for orthodontia. In fact, trends are headed in the other direction.

Here are the orthodontic-maximum trends in Delta Dental’s book of business over the last decade:

Orthodontic Maximum

2007

2008

2009

2010

2011

Under $1,000

1%

1%

2%

1%

2%

$1,000

21%

20%

23%

23%

21%

$1,200

2%

3%

2%

2%

2%

$1,500

29%

31%

23%

23%

22%

$2,000

4%

4%

6%

6%

6%

Other

2%

2%

4%

4%

4%

None

41%

39%

40%

41%

43%

The ortho-max category that’s grown the most over the last 10 years is “none.” Its growth has consistently come at the expense of the second-most-common ortho max, the $1,500 maximum.

However, the percentage of groups with a $2,000 annual max has tripled over the decade. The percentage of groups with a maximum of “other” (almost always above $1,500, and very often above $2,000) has quadrupled. Factoring in growth in Delta Dental’s book of business, real growth in the number of groups with maximums above $1,500 exceeds 700 percent.

What’s behind the eroding of the middle of the ortho-max class? Cost and utilization. Orthodontia claims make up a smaller percentage of all dental claims. In 2002 they made up 6.9 percent of dental claims; in 2011, they made up 5 percent.  This doesn’t necessarily mean that fewer children are getting braces; it means that the rate of orthodontia procedures is not going up as fast as other procedures. More than 60 percent of children may be getting braces, but there are fewer children, and therefore fewer potential ortho cases.

(There’s also a chicken-and-egg effect. Fewer ortho claims is also a function of fewer plans covering ortho.)

Also, orthodontia has increased by more than 20 percent over the last decade. Groups that had a $1,500 ortho max in 2002 would have to have a $1,800 max in 2012 just to keep up with dental cost inflation.

Groups with ortho expecting high utilization from their members may find value in paying an extra 4 percent for a higher ortho annual maximum.

At any rate, it appears higher ortho annual maximums are here to stay – and no ortho coverage is becoming the standard for most dental plans.

Our Dentists, Our Networks

One of the distinguishing characteristics of Delta Dental of Wisconsin is that we have two dentist networks available to our more than 1.5 million members. We offer a PPO like most other insurance companies and, as an added benefit, we offer the Delta Dental Premier network.

The Delta Dental Premier network, with more than 3,800 places to access care, is the state’s largest dentist network. The Delta Dental PPO network has close to 1,800 access points, and gives you more places to access care than any other state PPO network.

Dentists in the Delta Dental Premier and Delta Dental PPO networks accept a set fee ceiling and will not charge a Delta Dental patient more than the agreed-upon fee. Delta Dental PPO dentists provide a greater discount, creating more cost savings for members. In addition, dentists in both networks agree to service guarantees and standardized claim processing policies, and provide quality care while keeping costs down.

Credentialing is required. All Delta Dental Premier and Delta Dental PPO dentists must meet Delta Dental’s high credentialing standards in order to maintain their network status.  All required elements are reviewed and updated regularly, giving you the assurance that every network dentist meets the highest standards for care and service.

Delta Dental’s Professional Relations team is dedicated to working with dentists, so that a network dentist has a clear and complete understanding of what their network status means. By creating relationships with dentists and their staff, the Delta Dental Premier network and Delta Dental PPO network have grown annually by 1 percent and 4 percent, respectively, over the past several years.

In a recent dentist survey, dentists and staff gave Delta Dental high marks for personal service, continuing-education opportunities, flexibility and claims processing with fast payment.

Delta Dental Premier and Delta Dental PPO dentists partner with Delta Dental to make our dental-benefit programs successful and enable positive oral health.

The Voluntary Difference

Nearly every day there’s a new article or study indicating that even more workplace benefits are being offered on a voluntary basis, making voluntary benefits the fastest growing segment of the employee-benefits market. This is a significant paradigm shift.

So what exactly does “voluntary” mean, and what are Delta Dental’s strategies for this important market segment?

Delta Dental defines voluntary dental insurance as a plan where more than 50 percent of the premium is paid by the employee. Not surprisingly, the sluggish economy of the past few years has spurred an increase in the number of employers who are offering benefits on a voluntary basis.

It’s an interesting dynamic. Many employers can’t afford to continue absorbing the cost of their current employer-paid dental program, even though dental benefits are a tremendous investment in preventive healthcare. And employees want dental insurance; it consistently ranks as the No. 1 benefit employees ask for after health coverage. Dental benefits are good for employees’ health and productivity, so it’s imperative that employers can provide comprehensive dental coverage to their employees – no matter who pays for it.

Enter Delta Dental, and our broadened communication efforts and significant additions to our product portfolio. You may have already read about our product enhancements geared toward the small-group market, including a Table of Allowances plan and MAC (Maximum Allowable Charge) plan options for several existing PPO plans. These plans are also well-suited for the voluntary environment. As the state’s No. 1 dental-benefits provider, we want to ensure that the plans most appealing to agents, employers, and employees are available – and within budget.

Improved employee communications are imperative to success in the voluntary market. Choosing to purchase voluntary dental insurance is a major decision; more than ever we need to educate and engage the end user—the employee – on the product’s benefits. So we’ve unveiled a comprehensive suite of materials – email campaigns, payroll stuffers, posters, and more – that can be given to employees before and during the enrollment process. These materials carry employees right up to the enrollment meeting, where they’ll receive new enrollment packets specifically designed to answer the questions we most frequently receive in a voluntary setting.

As the voluntary market continues to evolve, we will continue to evaluate the market for the dental-benefits products best-suited for Wisconsin, and keep establishing best practices for the entire enrollment process.

We’re offering more products … more tools … more reasons than ever for the voluntary market to experience the Delta Dental Difference.

The Trends In Trend

It’s shouldn’t come as a surprise to anyone that dental costs go up over time. There could be several reasons why, depending on the type of coverage you have, but a key reason is trend.

Trend is the rate of change in dental costs due to changes in dentist fees and patient utilization. It’s usually expressed as an annual rate. Recently trend has been at near all-time-low levels, both for Delta Dental of Wisconsin and throughout the industry.

Trend has three main components: fee, utilization and intensity.

Fee increases occur when dentists increase the amount they charge for covered procedures. Delta Dental helps control fee trend by establishing fee schedules with dentists that cap the fee for each procedure.

Over the past 15 years, industry fee trend has run from 3 percent to more than 6 percent, with the average between 4.5 percent and 5 percent. Due in part to the sluggish economy, fee trend over the last two to three years has been roughly 3 percent to 3.5 percent, the lowest in the last 15 years.

Utilization is the number of procedures per covered member. This is a function of the patient, the dentist and the plan design.  Generally speaking, the richer the plan design, the more likely patients will use the plan.

Patient-utilization patterns can change significantly over time because of plan changes, anticipation of loss of coverage, changes in disposable income, and response to marketing. Also, dentists can impact utilization by recommending (or not recommending) certain procedures. The number of procedures per member per month can sometimes change by more than 5 percent in comparing two rolling 12-month periods that are just three months apart.

While utilization can vary significantly in the short term, long-term changes are more gradual.  The slope of the best-fit line over the last several years has been only slightly positive.   Recognizing the long-term trend helps to keep overall trend estimate relatively stable – and this contributes to overall rate stability for Delta Dental customers.

Most of Delta Dental’s plan designs encourage members to use preventive and diagnostic services, which should reduce the long-term utilization of many basic and major services.

The third component of trend is intensity of services. Here’s what we mean: Assume the mix of services for one block of business is broken up 40 percent preventive and diagnostic, 30 percent basic and 30 percent major. Then, assume another block of business with the same fees and the same total utilization has a mix of services that is 50 percent preventive and diagnostic, 25 percent basic and 25 percent major. The total cost for the second block would be lower because the usage is more heavily concentrated in lower-cost procedures.

For any specific block of business, the intensity of services will shift over time, producing intensity trend. This type of trend is normally not too large in magnitude over short periods of time, but can be fairly significant over several years.

Oral-health changes across the insured population have an impact on intensity trend. For example, the number of cavities per child today is lower than it was 30 or 40 years ago.

 Intensity trend can also be affected by changes in technology and services being offered. For instance, implants and teeth whitening are now widely available and increasing in frequency.

For most of the last five years, intensity trend has been slightly negative, which means a greater concentration of lower-cost services. However, recent data indicates that intensity trend could be turning slightly positive as the economy improves and people have income available for higher-cost, discretionary services.

Trend has a lot of moving parts, and Delta Dental is actively involved in forecasting long-term trend and trying to minimize and stabilize trend. We’ll keep you posted on how we’re doing.

Small-Group Choices, Agent Voices

You may have heard about the changes to Delta Dental’s sales organization. Maureen Noteboom is joining Delta Dental as the director of account management, and my role has changed as well. After working for Delta Dental as a product specialist and moving into sales operations, I now will be managing the company’s small-group and individual sales division.

I suppose that makes me Delta Dental’s small-group expert, which isn’t quite true. There are many small-group experts at Delta Dental. Some, like Jackie Bloomer, you already know. But speaking as the person who’s at the head of Delta Dental’s small-group and individual division, I have to say I am excited about Delta Dental’s small-group product initiatives – especially since part of my new responsibilities includes product management.

Good things are happening at Delta Dental with the launch of our new pool products and voluntary programs. We now have Maximum Allowable Charge options and a table-of-allowances plan; together they add more than 50 iterations to our product array. We’re also examining the relationship between participation and small-group pricing, and have taken steps to ensure that our highest-participating small groups get some of our best rates. (By the way, check out the gem that we have for über-small groups – our 2-4-enrolled product.  It’s hands-down the most competitive comprehensive dental plan for 2-4-sized groups offered by any carrier in Wisconsin.)

Beyond that, we are providing some dedicated resources to the two-to-49-enrolled market segment. We have a full-time voluntary-benefits specialist who has spearheaded the development of our first employee-facing materials. We now have employee-facing brochures, emails, posters, check-stuffers, and newsletter articles. Not all of these will be appropriate for every 2-49-enrolled group, but they’re here if you need them.

However, all of our small-group changes don’t mean much without the support of our agent partners. My primary goal is to advocate the voice of the customer – namely, our agents. Agents have always been and will continue to be an important, primary means of selling our products. With the small-group market getting more complex and competitive, we want agents who work in this segment to know they have a voice at Delta Dental. We are focusing our energies and resources on helping them increase their sales revenues.

One of the things we’re doing to help agents increase their sales revenue is our new “Pad Your Sales” small-group sales contest. It’s a great opportunity for agents to check out Delta Dental‘s new small-group lineup and put it to work with some of their prospects. Three iPad 3s are the top prizes, but there are plenty of other prizes, and as part of the contest we’re offering free webinars designed to help agents sell more small-group dental. Watch for more details on this contest.

We know that on average dental benefits only get 11 percent of agents’ time and attention. That time shouldn’t be spent dealing with red tape. My goal is to make doing business with Delta totally easy, with no hurdles to jump through. One way to accomplish that is to leverage technology as a service enhancement, rather than abandoning agents to the abyss of an online, self-service world.

I also want agents to know that when it comes to their small-group business they have a voice within Delta Dental. I will listen to agents’ concerns, talk price and benefit, and do all I can to make sure that the best small-group dental products they can offer their customers are Delta Dental products.

Over the coming months I hope to personally meet with many of you. We don’t want to simply pay lip service to industry experience and the difference it can make. At Delta Dental, we want to live it. Let us know how we’re doing.

The (Data-Driven) Delta Dental Difference

Everyone’s trying to accomplish more in less time, and the employee-benefits industry is no exception. Insurance producers — agents and consultants – divide their time and attention among up to 10 types of employee benefits, with medical insurance leading the way. Delta Dental of Wisconsin survey data show that health/medical insurance takes up 53 percent of agents’ time, while only 11 percent of their time is spent on dental insurance.

Delta Dental of Wisconsin is constantly working to provide our agents, groups and subscribers with outstanding service and support, so that the limited time they spend on dental benefits is easy and stress-free.

To achieve this goal, in 2010 we began conducting an annual survey of agents throughout the state to find out how we stack up against our competition and how we can make agents’ experience with us even better.

Our annual survey, now in its third year, asks agents to rate us and our competitors on 19 different attributes, ranging from how well we provide customer service to brand reputation to claim-payment accuracy. Agents rank these attributes when deciding where to place dental business and rate each carrier’s performance on these attributes.

Agents named customer service, claim-payment accuracy, rate stability, network strength, pricing, and ease of administration for groups as the most important attributes to them.

Survey results show that Delta Dental of Wisconsin performs better than our competitors on these key attributes. While our competitors are rated favorably on a few attributes, we received the highest score on virtually every attribute being measured (15 of the 19, in fact). By looking at the total picture – carrier ratings and agent comments – it is clear that we are agents’ overwhelming carrier of choice.

All of this positive feedback is nice, but we aren’t going to rest on our laurels; we are always looking for ways to provide an even better experience to anyone working with Delta Dental of Wisconsin.

By employing a data-driven approach – constantly evaluating what we are doing and asking agents how we can better serve them and their clients – we are committed to maintaining our place as Wisconsin’s top dental-insurance carrier.

Annual-Maximum Trends: The Slow, Steady Creep Upward

The traditional one-sentence explanation of annual-maximum trends in dental insurance over the last decade has been, “The $1,000 annual maximum has become the standard” – and it has. But what’s happening outside of the $1,000 annual max is perhaps even more interesting.

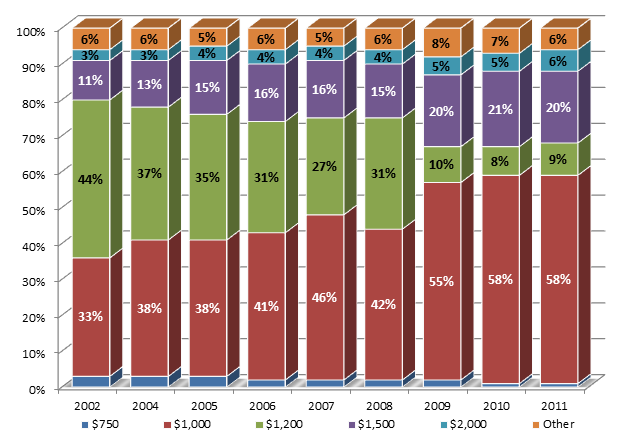
Consider this graph of annual maximums in Delta Dental’s book of business over the last decade:

The $1,000 annual max has become far more popular, increasing in frequency from one-third of Delta Dental’s book to almost 60 percent of the book, almost entirely at the expense of the $1,200 annual maximum. But consider this: Over the same period the $1,500 annual max has nearly doubled in popularity, and the $2,000 annual max has doubled in popularity.

Some reasons why are fairly obvious. Dental costs have increased approximately 20 percent since 2002. An aging workforce requires more expensive dental treatments. And a higher dental annual maximum can help offset cutbacks in healthcare coverage.

However, some of these pat explanations may not really explain what’s going on. The frequency of expensive treatments like root canals and crowns has actually fallen over the last 10 years, from 21.1 percent to 17.3 percent. The real increase in utilization has come from increased consumption of preventive services like cleanings, the result of more dentists putting more patients (with dental insurance) on a regular treatment regimen.

The actual reasons behind the shift to higher annual maximums are more complex, and deal with the interaction between dental care and overall healthcare. For consumers, the money to pay dental bills and doctor bills comes out of the same pot. Very often it’s in an HSA or flex account. A higher annual maximum in dental means that less money has to come out of that healthcare pot to pay for a crown, a root canal or an implant – and the tradeoff in cost is reasonable.

With more employees paying a greater percentage of their premium, this sort of tradeoff should only increase in frequency.

The $1,000 annual maximum isn’t going anywhere. It is the standard, and will remain the standard. But higher annual maximums are here to stay as well.

Periodontal Disease and Heart Disease

The most common form of heart disease, called coronary heart disease (CHD), is caused by the buildup of fatty plaques within the walls of the arteries that deliver blood to the heart muscle. When these arteries become clogged, blood flow stops and the heart muscles are deprived of oxygen, resulting in damage to the heart muscle. This is commonly called a heart attack. CHD is the most common cause of death for both men and women in the United States.

Many factors increase an individual’s risk for CHD, and only some are controllable.  Age, gender, race, and family history of CHD are risk factors we cannot change. Other recognized risk factors we can control: blood pressure, diabetes, blood cholesterol, obesity, smoking, diet, and exercise.

Another controllable risk factor identified in many studies is the presence of periodontal (gum) disease. While we know that periodontal disease adds to an individual’s risk, we have not yet shown that treating periodontal disease lowers an individual’s overall risk for CHD.

The association between periodontal disease and CHD is well-recognized but poorly understood. With so many factors adding to the risk for CHD, it’s very hard to single out one factor and determine the impact and reason for that one interaction.

There are several theories for why this interaction occurs. One is that the bacteria that cause periodontal disease release toxins and molecular signals into the bloodstream, triggering CHD. Some of these bacteria have been found within diseased coronary arteries. We also know that chronic inflammation resulting from periodontal disease causes the body to produce a protein called C-reactive protein (CRP). Elevated CRP has been identified as a major risk factor for CHD. Treating periodontal disease has been shown to lower overall levels of CRP and other inflammatory markers in the blood, so there is hope that someday we may be able to show that treating periodontal disease actually reduces the incidence and severity of CHD.

What can you do now to reduce your risk of CHD? Try to address each of the controllable risk factors to the best of your ability, including periodontal disease. Regular dental exams can catch periodontal disease at early stages when it is easier to treat and reverse. If you have been diagnosed with periodontal disease, regular maintenance is key to controlling inflammation and reducing the production of C-reactive protein.

Although we can’t say today that treating your periodontal disease will reduce your chance of a heart attack, it will result in a much higher level of oral health and hopefully overall health. With so many factors contributing to the risk for CHD, controlling or eliminating this one may make a difference.

What does typical dental insurance coverage look like?

Have you ever wondered, “What does typical dental insurance coverage look like?” This question is being asked more frequently with the Affordable Care Act’s inclusion of pediatric oral-health benefits as one of the 10 essential-health-benefits categories.

As details of the ACA are clarified, the phrase “typical employer policy” is being used to describe what benefits should be covered. The ACA’s involvement makes this a good time to describe what “typical” dental-insurance coverage looks like to Delta Dental.

In order to define typical dental coverage, it’s important to understand the different types of dental coverage. Dental coverage is usually defined by network structure, and commonly falls into one of three categories: Dental Health Maintenance Organizations (DHMOs), Dental Exclusive Provider Organizations (DEPOs, usually shortened to EPOs), and Dental Preferred Provider Organizations (DPPOs, usually shortened to PPOs).

DHMOs and EPOs require members to use in-network dentists to receive a benefit. DHMOs make members pick one primary-care in-network dentist, while DEPOs let members use any in-network dentist. PPO members don’t have to see network dentists, though benefits can be better if they do.  PPO designs can have the same benefits in- or out-of-network (passive PPO), or richer benefits for members who choose network dentists (traditional PPO).

The passive PPO is a very common design, making it an ideal foundation for defining typical dental coverage.

PPO designs typically include three elements related to paying for the cost of care: deductible, annual maximum, and coinsurance.

The deductible is the amount of dental expenses that the member pays before the policy pays toward the cost of care. Deductibles are typically annual, but “annual” could refer to calendar-year or policy-year. There is no “typical” definition of “annual” in dental insurance.

It’s common for dental plan designs to waive the deductible on preventive services. This means the dental policy will cover its share of preventive costs regardless of whether the member has paid the annual deductible.

The most common deductible is $50 for an individual, with a maximum of three times the individual deductible for family coverage.

The annual maximum is the maximum dollar amount that the dental policy will be pay out over a 12-month period. Similar to the deductible “year”, the annual-maximum “year” can be a calendar year or policy year. The most common annual maximum is $1,000.

Coinsurance refers to how much of a given claim is covered by the dental policy after the deductible (if applicable) is paid, subject to the annual maximum limit. Coinsurance amounts are typically presented as the percentage paid by the dental plan. For example, with 100% coinsurance, the procedure is covered in full by the dental policy after the deductible is satisfied, subject to the annual maximum.

Dental benefits are typically subdivided into preventive, basic, and major services. Each category can have a different coinsurance level, and the services in each category can vary from policy to policy. The most common dental plan design has 100% coinsurance for preventive services (like cleanings and X-rays), 80% for basic services (like fillings), and 50% for major services (like crowns).

The last remaining piece of the coverage puzzle is orthodontia. Orthodontia benefits for children and/or adults usually have coinsurance and a lifetime maximum, meaning the amount paid by the policy is limited over the time coverage is in effect and does not reset.

Orthodontia is found in about half of all dental plans. If the plan does cover orthodontia, the most common design is child-only orthodontia with 50% coinsurance and a lifetime maximum of either $1,000 or $1,500.

So, there it is: To Delta Dental, typical dental coverage is:

  • a passive PPO
  • with a $50 individual/$150 family deductible
  • and a $1,000 annual maximum

that covers:

  • preventive services at 100%,
  • basic services at 80%
  • and major services at 50%.

If orthodontia is covered, it will likely be child-only coverage with 50% coinsurance and either a $1,000 or $1,500 lifetime maximum.